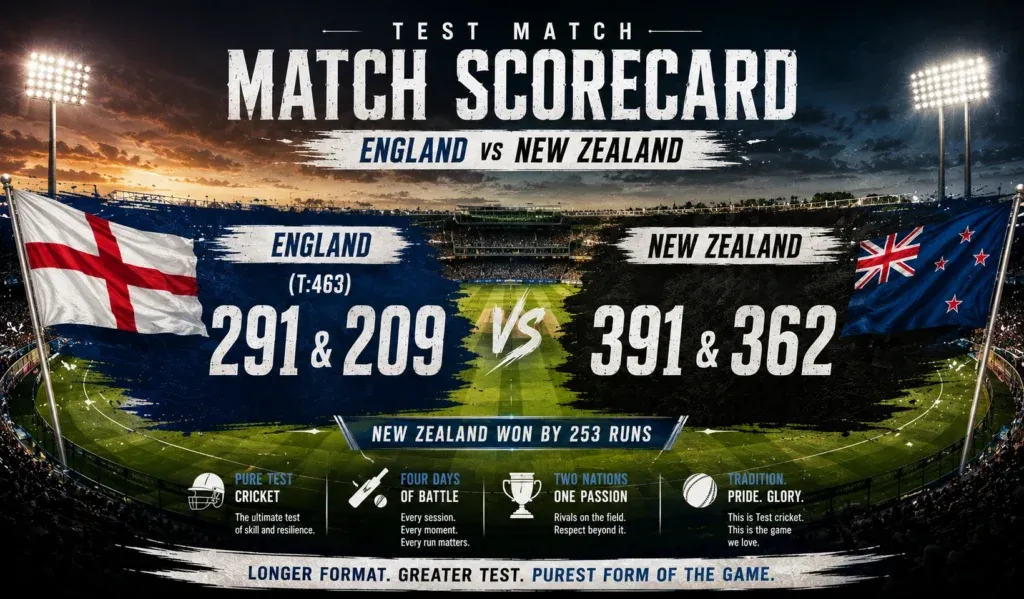
A cricket scorecard gives readers much more than the final result of a match. On Cricketscoreise.com, readers can explore how individual performances, innings progress, and important match figures fit together. Some people only check which team won, while others want to understand how the result happened. Both approaches are possible, but a detailed scorecard offers considerably more information. It records the main events of an innings and helps explain how teams performed under different match conditions.
A completed scorecard works like a record of everything important that happened during a match. It shows the runs scored, wickets lost, overs completed, and contributions made by individual players. Readers can also find information about partnerships, bowling spells, extras, and the final result. These details become useful when someone wants to review a match after the live action has finished. Even a short match summary can make more sense after checking the complete figures.
Start With Match Details
Before looking at individual statistics, readers should check the basic match information. The scorecard normally identifies the two competing teams and the competition name. It may also show the venue, match date, and scheduled format. These details help readers understand the conditions in which the game took place. A scorecard from a Test match should not be read exactly like a T20 scorecard.
The match format determines several important parts of the scorecard. Test cricket can include two innings for each team, depending on how the match develops. One-day cricket normally provides each team with fifty scheduled overs. T20 cricket generally limits each side to twenty scheduled overs. Some domestic competitions use different playing conditions, so checking the match details first remains useful.
Readers should also notice whether the scorecard represents a completed match or an ongoing contest. A live scorecard changes as new deliveries are bowled and wickets fall. A completed scorecard contains the final figures after the innings or match ends. This difference matters when comparing statistics from different sources. An unfinished innings should never be treated as a final batting performance.
Understand The Innings Layout
Most cricket scorecards separate information according to innings. Each innings has its own total, wickets lost, and overs completed. In a regular limited-overs match, readers usually see one innings from each team. Test matches can contain more innings, making the layout slightly different. The innings labels help readers understand which team batted first and which team followed.
The first innings establishes the score that the opposition must chase. If the batting team scores 178 runs, the chasing team generally needs 179 runs to win. The exact target can change when playing conditions require an adjustment. Rain interruptions and revised targets can affect the number of available overs. Readers should therefore check the result details before assuming that the original total decided everything.
An innings total combines the runs credited to batters with recorded extras. The number of wickets lost appears alongside the total in most scorecard displays. A score of 178 for six means the team scored 178 runs and lost six wickets. It does not mean six batters scored those runs together. This simple distinction helps prevent confusion when reading unfamiliar scorecards.
Read The Batting Table
The batting table is usually one of the largest sections of a cricket scorecard. It lists the players who appeared during the innings and records their individual contributions. The runs column shows how many runs each batter scored. Balls faced explain how many deliveries the batter received while batting. These two figures provide a useful starting point for understanding performance.
Boundary columns normally show the number of fours and sixes scored. A four records a boundary where the ball reaches the boundary after touching the ground. A six records a boundary where the ball clears the boundary without bouncing. These figures help readers understand how a batter collected runs. They do not explain every scoring method, because batters also collect runs through running between wickets.
The batting table may also include a strike rate for each player. This statistic measures the number of runs scored per hundred balls faced. A higher strike rate generally means the batter scored more quickly. However, a high figure does not automatically mean the player performed better. The required scoring rate, match format, and innings situation all matter when judging that performance.
Check The Bowling Figures
Bowling figures explain how each bowler performed during the opposition innings. The table commonly includes overs, maidens, runs conceded, and wickets taken. These figures provide a quick picture of the bowling attack. Readers can identify which bowlers delivered the most overs and which players took important wickets. The information also helps explain how the batting side reached its final total.
Economy rate is another important statistic within bowling figures. It represents the average number of runs conceded per over. A lower economy rate generally indicates that the bowler restricted scoring effectively. Still, economy should never be considered without the wicket column. A bowler taking important wickets might concede more runs while attacking the batting lineup.
The number of overs also needs careful attention during comparisons. A bowler who delivered four overs cannot be compared directly with someone who delivered only one over. Their responsibilities and opportunities were different during the innings. Readers should examine the complete bowling table before deciding which player performed better. Match situations often explain why captains use certain bowlers for shorter spells.
Follow Partnerships And Progress
Partnerships show how two batters contributed together during an innings. They are recorded between the fall of one wicket and the next dismissal. A strong partnership can help a team recover after losing early wickets. It can also allow an established batter to continue scoring with support from the other end. Partnership information adds useful context to individual batting figures.
Imagine a team losing two wickets during the opening overs. A partnership of eighty runs can help the batting side regain control. The scorecard may show how many runs the partnership produced and how many balls it required. This information helps readers understand whether the batters scored steadily or accelerated quickly. It also explains why the innings total increased during that period.
Some scorecards include a fall of wickets section alongside partnership information. This section records the team score when each dismissal occurred. It may also identify the batter who lost their wicket at that stage. Readers can use these figures to understand how the innings developed. A team losing wickets at regular intervals often faces a different challenge from one losing several batters together.
Recognise Different Dismissals
Dismissal information explains how each batter left the crease. Common dismissal types include bowled, caught, leg before wicket, and run out. Other possibilities include stumped, hit wicket, and caught behind. These descriptions appear beside player names or within a separate dismissal column. Learning the common terms makes the batting table easier to understand.
A bowled dismissal means the delivery hit the batter’s stumps. A caught dismissal happens when a fielder catches the ball after contact with the bat. Leg before wicket involves the ball hitting the batter’s body under specific conditions. A run out occurs when the fielding team breaks the stumps before the batter reaches safety. Each dismissal tells readers something about how the wicket happened.
The scorecard may identify the bowler and fielder involved in a dismissal. This information helps readers recognise important bowling and fielding contributions. A caught dismissal can credit the bowler and identify the catcher. A run out may show the fielder responsible for completing the dismissal. These details are useful when reviewing individual match performances.
Understand Extras And Totals
Extras are runs that do not belong directly to individual batters. They can include wides, no-balls, byes, and leg-byes. Penalty runs may also appear under particular playing conditions. The extras section records these contributions separately within the innings. Readers should include them when understanding the final team total.
A wide delivery usually gives the batting side an additional run. A no-ball also carries a penalty under the relevant playing conditions. Byes occur when the ball passes the batter without touching the bat or body. Leg-byes are recorded when the ball touches the batter’s body under permitted circumstances. These categories follow different scoring rules, even though they all increase the team total.
The extras figure should match the combined amount recorded across its categories. If a team scores 160 through batters and receives twelve extras, the innings total becomes 172. This calculation helps readers check the scorecard correctly. It also explains why the total can differ from the sum of individual batting runs. Readers should avoid adding extras twice when reviewing the innings.
Compare Both Team Innings
Comparing both innings helps readers understand how the match developed. The first team’s total provides a target or reference point for the opposition. The second team’s score shows whether that target was reached. Readers should consider wickets lost and overs used alongside the final totals. A simple comparison of runs does not always explain the complete result.
For example, one team might score 190 runs in twenty overs. The opposition could reach 191 runs with only three wickets lost. This result shows that the chasing side completed its target successfully. Another team might finish on 185 after losing all available wickets. The score difference explains the result, while the batting and bowling tables explain how it happened.
The required run rate becomes important during a limited-overs chase. It shows how quickly the batting team needs to score from that point. The current run rate shows how quickly the team has scored already. Comparing these figures helps readers understand the pressure during a chase. Wickets remaining and overs available provide additional context for that calculation.
Check The Match Result
The result section usually appears near the bottom or top of the completed scorecard. It states which team won and describes the winning margin. A team may win by runs when defending its first innings total. A chasing team may win by wickets after reaching the target. These descriptions explain the basic outcome without requiring readers to calculate everything themselves.
A match can also finish as a tie, draw, or no result. A tie occurs when both teams finish with equal scores under the relevant format. A draw commonly applies to Test matches where neither side wins. A no result can happen when weather or other circumstances prevent a meaningful outcome. These terms describe different situations and should not be used interchangeably.
Readers should also check whether a match required a revised target. Rain interruptions can change the available overs and target under applicable playing conditions. The result may therefore depend on a revised calculation rather than the original target. The scorecard or match summary should identify the relevant outcome. This information becomes particularly important when reviewing interrupted limited-overs matches.
Use Scorecards For Comparisons
Completed scorecards are useful when comparing players across several matches. Readers can review batting totals, strike rates, wickets, and economy rates. Looking at several performances gives a wider view than checking one match alone. A batter who scores consistently across different conditions may offer a different contribution from someone with one unusually large innings. Repeated performances provide more useful context.
Team comparisons also become easier through match records. Readers can examine how often a team builds strong opening partnerships. They can compare bowling performances during the middle overs. They can also review how effectively teams finish their innings. These patterns may reveal strengths that are not obvious from the final result alone.
However, comparisons should use similar formats and playing conditions whenever possible. A player’s T20 statistics should not be judged exactly like Test statistics. Different roles also affect the opportunities players receive during matches. An opening batter and a lower-order batter usually have different responsibilities. Fair comparisons require readers to consider those differences.
Avoid Common Reading Mistakes
One common mistake involves confusing overs with individual deliveries. An entry such as 14.3 means fourteen completed overs and three additional legal deliveries. The decimal number does not represent a fraction of an over. This notation is important when checking remaining overs and run rates. Readers should remember that a standard over contains six legal deliveries.
Another mistake involves judging players through one statistic only. Runs scored do not explain how quickly a batter played. Wickets taken do not reveal the complete bowling performance. Economy rate does not show every important moment during a spell. A proper review considers several related figures together.
Readers should also check whether the scorecard is updated correctly. Live match pages can occasionally display delayed information during busy periods. A refresh may be necessary before the latest delivery appears. Completed scorecards should be checked against the final match result. This small habit can prevent unnecessary confusion.
Conclusion
A cricket scorecard becomes easier to understand when readers know what each section represents. Batting figures, bowling statistics, partnerships, extras, and match results all provide useful information. Checking these details together gives readers a clearer picture of how teams performed. Regular practice also makes unfamiliar abbreviations and statistics easier to recognise. Explore detailed cricket scorecards, follow upcoming matches, and keep improving your understanding of every innings with confidence.
Read also :-
न्यू झीलंड राष्ट्रीय क्रिकेट संघ वि भारत राष्ट्रीय क्रिकेट संघ सामन्याचे स्कोअरकार्ड